Guides / Apps & Integrations / Show live data on screen

Show live data on screen

Connect a spreadsheet, API or social account as a data source, then bind its fields into a design.

A data source is a live feed that Brix reads: a spreadsheet, a web address, an uploaded list or a signed-in account. Use this guide to add a source, and to put its fields into a design. Every task below starts on the Data sources tab of Templates.

What you can do

Find the Data sources tab

  1. Select Templates in the Content group of the sidebar.
  2. Select the Data sources tab.
  3. Read the Connected accounts cards at the top of the tab.
  4. Read the Test APIs cards under them.
  5. Scroll down to the category sections.
  6. Read the line under a source name for the record count and the last sync time.
The Data sources tab, with a category section for each kind of feed and an Add Source button on every one.
️ Each source row carries a green Connected pill or an amber Pending pill.
️ Each category card names the columns Brix expects. The card marks some of those columns optional.
️ The source rows under a category heading are read-only. Brix offers no edit, resync or delete control on those rows.

Install a test API to practice with

  1. Open the Data sources tab.
  2. Find the Test APIs section.
  3. Select Install beside the feed you want.
  4. Wait for the button to become a green Synced pill.
️ The four test feeds are London Underground line status, NBA scores, Hacker News top stories and USGS earthquakes.
Install also syncs the feed at once, so its fields are ready to bind.
️ The green Synced pill is also the remove control. Point at the pill until the label reads Unsync, then select the pill.
Unsync deletes the source from your workspace. A design bound to that source loses its fields.

Add a public JSON address

  1. Open the Data sources tab.
  2. Select Add Source beside the API endpoints section.
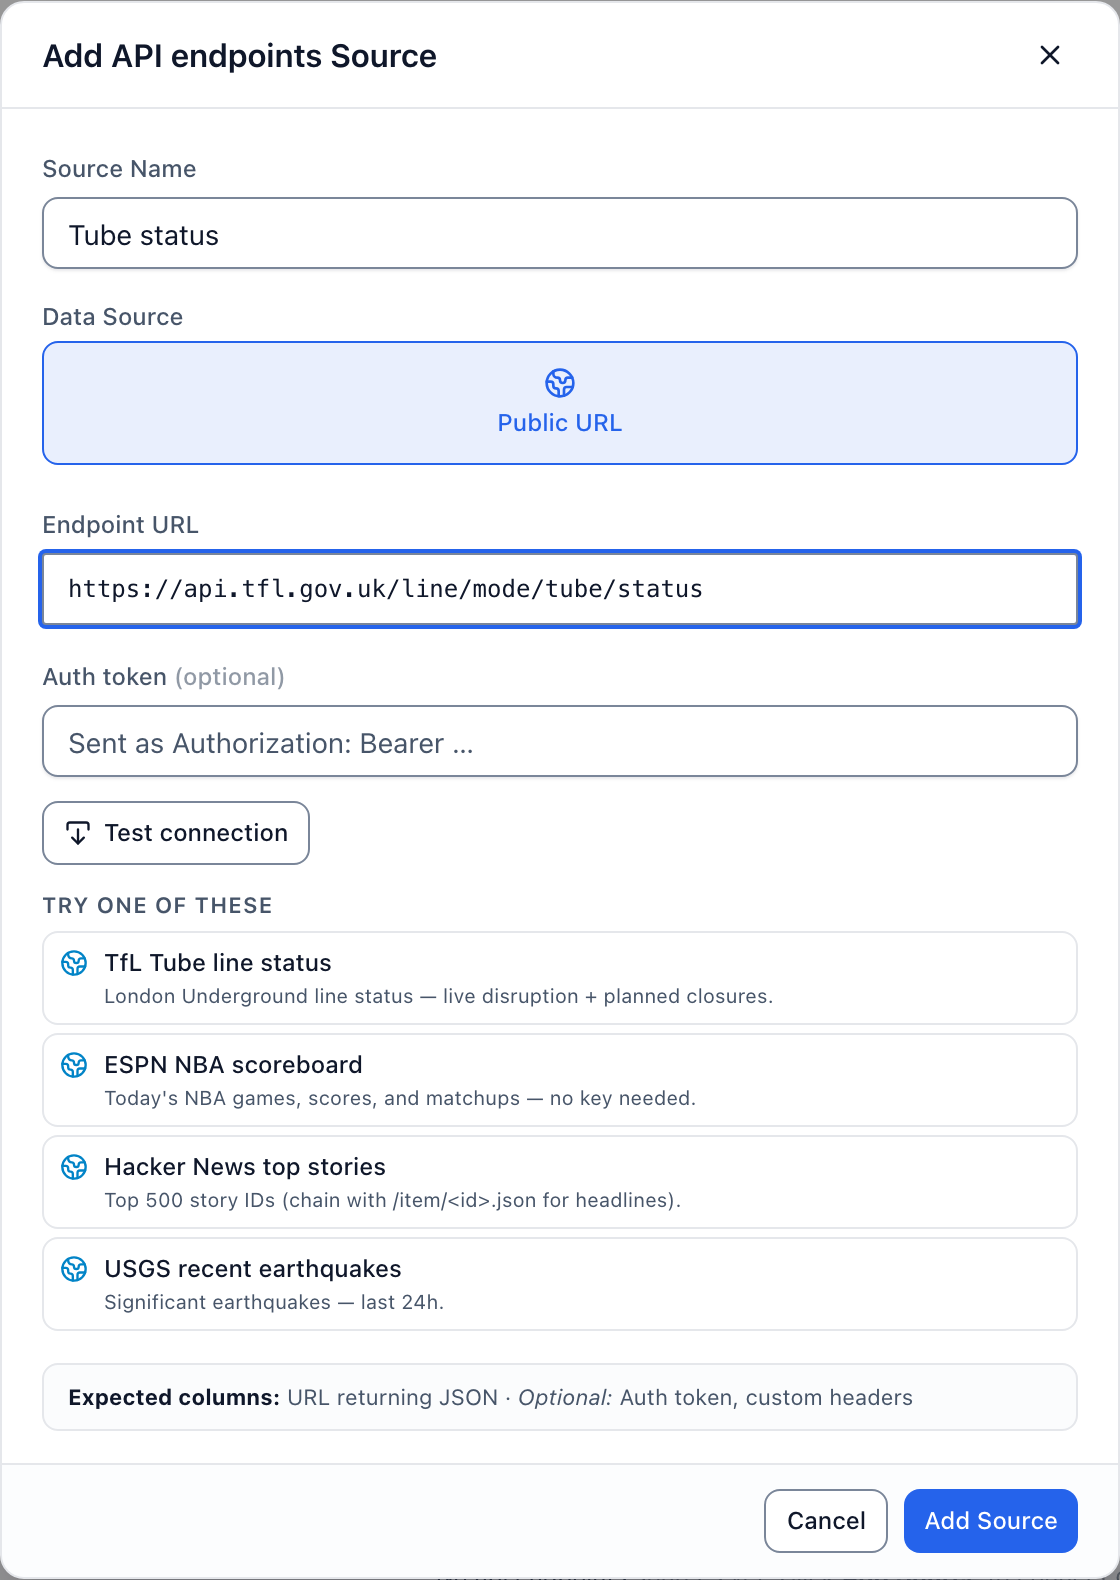
  3. Type a name into Source Name.
  4. Paste the address into Endpoint URL, or select an example under Try one of these.
  5. If the feed needs a bearer token, paste the token into Auth token.
  6. Select Test connection.
  7. Read the sample response under the button.
  8. Select Add Source.
The Add Source dialog for a public JSON feed: the name, the address, the optional token and the example list.
Test connection runs from the Brix servers, not from your browser. The test proves that the sync itself reaches the address.
️ The sample response shows the first 600 characters that the address returned.
️ You cannot select Add Source until Source Name and the address both hold a value.

Upload a list of birthdays, events or products

  1. Open the Data sources tab.
  2. Select Add Source beside Celebrations, Event centers or Point of sale.
  3. Type a name into Source Name, such as Team Birthdays.
  4. Select Download CSV template to see the columns Brix expects.
  5. Drop your CSV or JSON file onto the upload box.
  6. Check the preview rows and the entry count.
  7. Select Add Source.
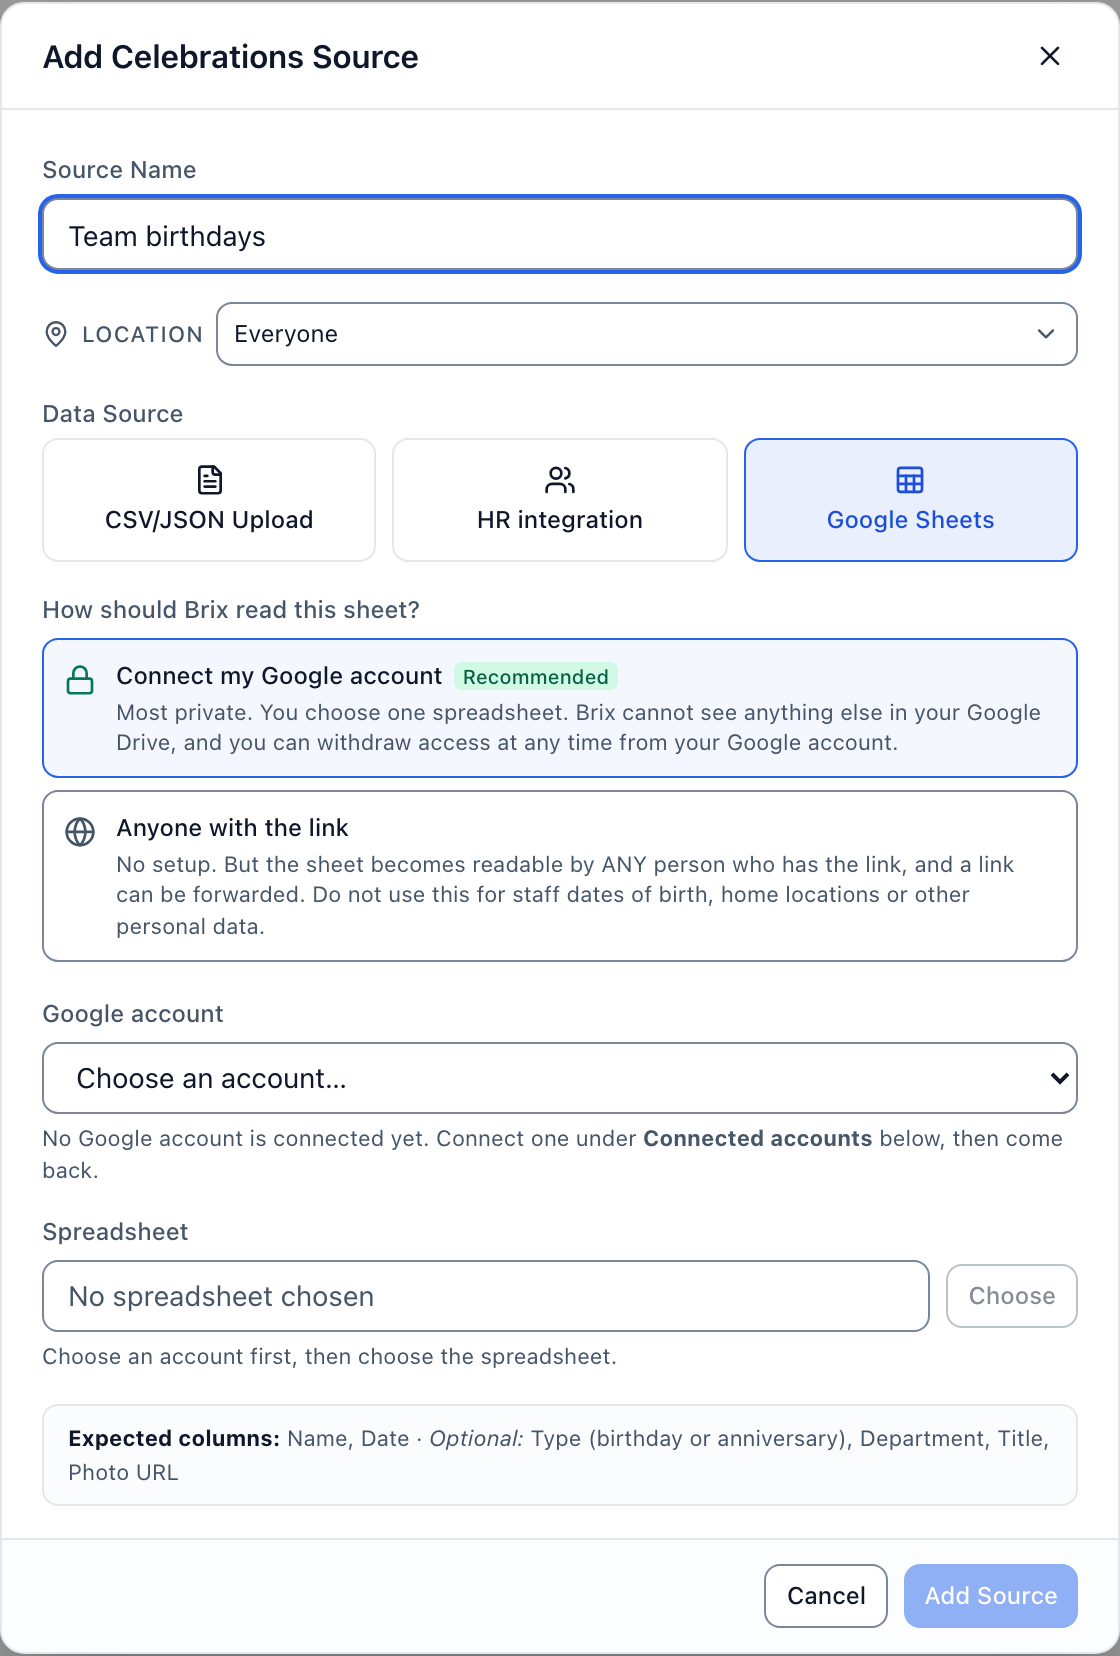
Celebrations needs a Name column and a Date column. Type, Department, Title and Photo URL are optional.
️ The preview shows the first four rows of your file.
️ An upload is a snapshot of the file. For data that has to keep changing, connect a Google Sheet or a hosted CSV address instead.

Connect a Google Sheet

  1. Open the Data sources tab.
  2. Select Add Source beside Celebrations, Event centers or Point of sale.
  3. Select Google Sheets in the Data Source row.
  4. Share the sheet with [email protected] as Viewer.
  5. Paste the sheet link into Google Sheets URL.
  6. Type a name into Source Name.
  7. Select Add Source.
️ Brix reads the sheet only after you share the sheet with [email protected] as Viewer.
Celebrations also offers HR integration with BambooHR and CharlieHR. The Workday button carries a soon label, and you cannot select the button.

Ask for a system we do not offer yet

  1. Open the Data sources tab.
  2. Select Add Source beside Point of sale, Event centers or Business KPIs.
  3. Select Request access in the Data Source row.
  4. Select the system you use under Which system?
  5. Add any detail in the message box.
  6. Select Register interest.
Register interest sends a request to the Brix team. Brix creates no data source from that request.
Point of sale offers Toast, Square and Clover. Event centers offers Momentus.
Business KPIs offers Stripe, Shopify, Salesforce, HubSpot, Google Analytics and Something else.

Connect a social or calendar account

  1. Open the Data sources tab.
  2. Find the provider card under Connected accounts.
  3. Select Connect on that card.
  4. Sign in on the provider page that opens.
  5. Return to the Data sources tab.
  6. Check that the account now appears on the card.
The Connected accounts cards, one for each provider, each with a Connect button and a line about what the connection needs.
️ YouTube and X ask for your own credentials. Every other provider sends the whole browser window to the provider sign-in page.
️ Bluesky and Mastodon need no account. Type a handle in the app instead.
️ Google Calendar and Microsoft 365 Calendar ask for read-only access. Pick the calendar or the meeting room later, inside the app.
️ Viva Engage and Microsoft 365 Calendar may need your IT administrator to approve access first.
️ When a provider sign-in is not ready yet, the message says so plainly. Nothing at your end needs a fix.

Connect a YouTube channel

  1. Open the Data sources tab.
  2. Find the YouTube card under Connected accounts.
  3. Select Connect.
  4. Type a label into Label, such as your school or venue name.
  5. Paste the channel identifier into Channel ID.
  6. Paste your key into YouTube Data API key.
  7. Select Connect channel.
️ Create the key in Google Cloud, under APIs and Services, with YouTube Data API v3 turned on.
️ Brix stores your key encrypted and never shows the key again. Keep your own copy.

Connect X with your own token

  1. Open the Data sources tab.
  2. Find the card for X (Twitter).
  3. Select Connect.
  4. Type a label into Label.
  5. Type the account name into Handle.
  6. Paste your App-only bearer token into X API bearer token.
  7. Select Connect account.
️ The token comes from your own X developer account, and you pay X for the access.
️ X limits how often Brix can read posts, so posts on screen refresh slowly.

Disconnect an account

  1. Open the Data sources tab.
  2. Find the account row under its provider card.
  3. Select Disconnect on that row.
  4. Open any app that used the account.
  5. Pick a different account in the app.
Disconnect removes the account at once, with no confirmation step.
️ Any app pointed at that account stops showing live data.

Bind a design to a data source

  1. Select Templates in the Content group of the sidebar.
  2. Select the Your designs tab.
  3. Select a design to open the editor.
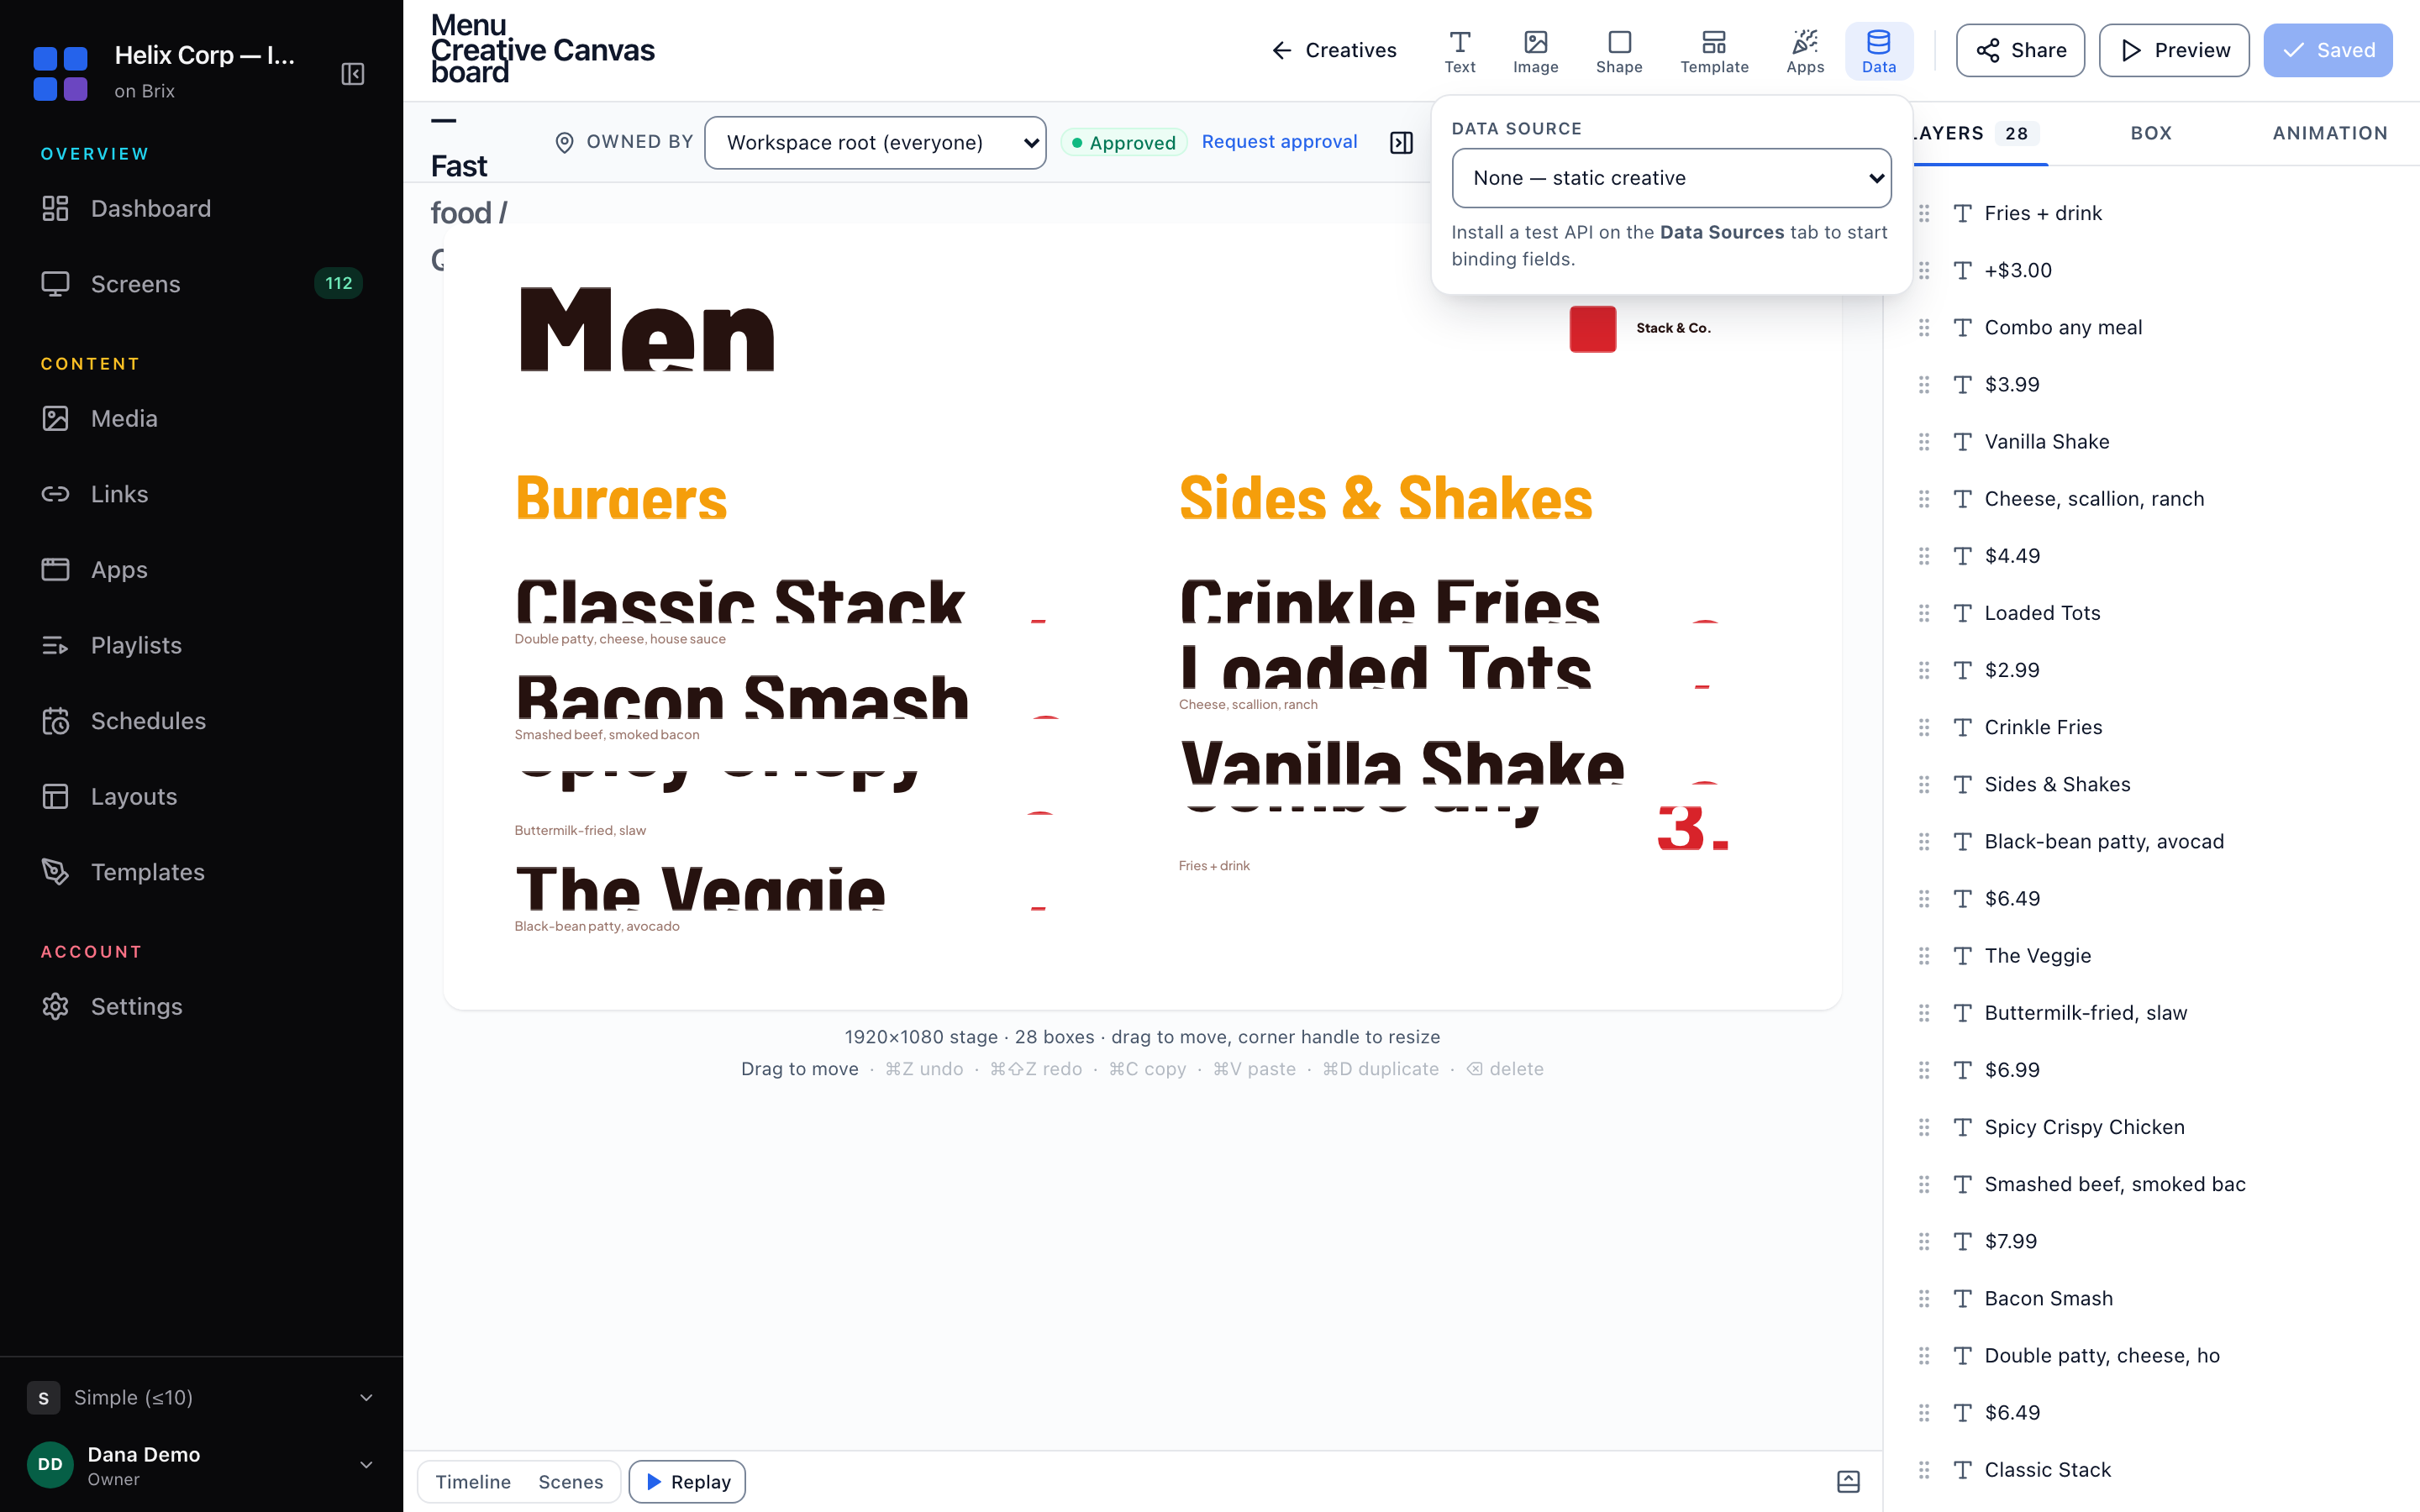
  4. Select Data in the toolbar above the canvas.
  5. Pick a source in the Data source list.
  6. Read the source type and the record count under the list.
The Data flyout open in the design editor, with the Data source list set to the static option.
️ A design with no source shows a prompt to install a test API. Install one of the four test feeds first.
️ A source that never synced reports no bindable fields. Select the refresh button to sync the source.

Put a live field on the canvas

  1. Open the design.
  2. Select Data in the toolbar.
  3. Type into Search fields to narrow the list.
  4. Select the field you want.
  5. Drag the new field box into position on the canvas.
  6. Style the box in the Box tab of the right rail.
️ Brix adds the field box in the middle of the canvas, above the layers already there.
️ The flyout counts the fields it found. Each row shows a sample value beside the field name.
Manage data sources at the foot of the flyout opens the Data sources tab in a new browser tab.

Pull the latest data into a design

  1. Open the design.
  2. Select Data in the toolbar.
  3. Select the refresh button beside the Data source list.
  4. Wait for the spinner to stop.
  5. Check the canvas for the new values.
️ The refresh button re-syncs the shared source. Every design and app bound to that source reads the new data.

Disconnect a data source from a design

  1. Open the design.
  2. Select Data in the toolbar.
  3. Select the unlink button beside the Data source list.
  4. Delete or replace any field boxes left on the canvas.
None — static creative in the Data source list does the same job as the unlink button.
️ The unlink button disconnects only the design. The data source stays in your workspace.

To drive an on-screen app from a data source, read add on-screen apps. To build the design that reads the fields, read design a sign. To put the finished design on a screen, read put content on a screen.

Ready to get started?

Open Brix Portal